Календарь взлётов и падений — трекер, который позволяет по завершении каждого дня оценивать его по 10-балльной шкале, собственноручно создавая инфографику — схему своих «американских горок» длиною в календарный год.
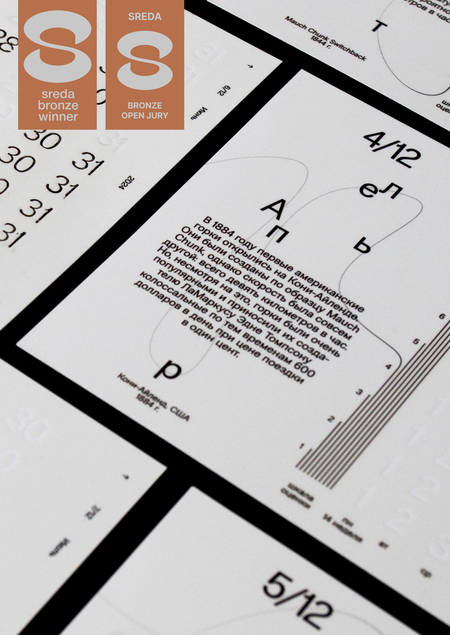
Макет страницы календаря делится на две части: слева раскрывается история появления и развития американских горок; справа ежедневно строится инфографика, визуально создающая образ американских горок.
Технически конструкция устроена так: на всей поверхности макета кроме цифр нанесён лак. При заполнении маркером краска остаётся на бумаге — то есть на цифрах, а с лака она стирается специальной губкой
Инфографика присутствует и на незаполненном календаре — в описательной части схематично и упрощённо изображены аттракционы, о которых идёт речь. Иллюстрация также плавно перетекает в шкалу оценки.


