Project Description
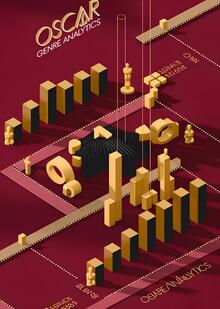
In this project, I examine the major trends in the world of cinema. Since I have always wanted to be involved in filmmaking and work as an environmental or creature designer, this topic seemed the most compelling to me.
The types of charts that appeared most illustrative of my analysis results:
Pie Chart Line Chart Bubble Chart Histogram
Enrollment
For the palette, I selected colors that most strongly evoke cinema for me. Primarily, this includes the movie theater, the bright screen, and the subdued lighting in the hall with red chairs.
I used the Adobe Color website to extract these colors.


#082640, #0477BF, #049DD9, #F20505, #400101
I chose the Courier typeface for styling text on the graphics. It turned out that this is the same font used for writing screenplays, as this specific font size helps estimate the runtime of the future film.

Schedules
To create the «Top 10 Stars by Box Office Gross» chart, we used GigaChat
Prompt: Build a line graph showing the number of films named in year
I asked GigaChat to write code for generating a chart titled «Top 5 Companies by Number of Films.»
Prompt: Build a pie chart with the top 5 companies that have the most names.
Subsequently, I enhanced the chart with code for visual styling.
Conclusion
The data analysis suggests that the 2000–2010s was the most productive decade. Since I would like to work in cinema, a film starring Robert Downey Jr. would be the best choice, as his movies have generated the highest box office revenue. Regarding the choice of company, any option is suitable in this case, as the number of films directed by the leaders is roughly equal.
Tools: Adobe Color (for creating color palettes) GigaChat (used in generating code)